
Opening a crypto price chart for the first time can feel like walking into a cockpit: red and green bars, colored lines, and numbers everywhere. Here is the reassuring part. Learning how to read crypto charts comes down to a few core ideas: price, time, candles, volume, and trend.
At CryptoCoinXInfo, we built this guide as a practical walkthrough, in the order you would actually use these skills. By the end, you will know how to read candlestick charts, recognise common crypto chart patterns, and follow a simple routine to analyze any chart calmly. If you are completely new to the space, start with our crypto basics for beging Beginner Basics first.
This guide is for education only. It is not financial advice, and nothing here predicts where any price will go.
Start Here: What You Are Actually Looking at on a Crypto Chart
A crypto price chart is a record of what buyers and sellers agreed a coin was worth over time. Time runs along the bottom. Price runs up the side. Every point, line, or bar records what happened in one period.
Charting platforms such as TradingView let you show the same data in different styles:
- Line charts join closing prices. They are clean and good for the big picture.
- Candlestick charts show far more detail for each period. Most traders prefer them.
- OHLC bar charts show similar data to candlesticks in a different shape.
Because candlesticks carry the most information, most of this guide focuses on them.
Why Learning How to Read Crypto Charts Matters
Charts show you what the market has actually done, not what people on social media say it will do. Even if you only buy and hold, understanding price history helps you judge volatility and avoid emotional decisions. It also makes coin research easier, so pair this guide with our coin explainers
The 5 Things to Check Before Reading Any Crypto Chart
Before hunting for patterns, check the basics. Skipping this step is the fastest way to misread a chart.
| Chart Element | What It Tells You | What to Check |
|---|---|---|
| Price | The coin’s value in a quote currency (USD, USDT, BTC) | Which pair are you viewing? BTC/USD and ETH/BTC are very different charts. |
| Timeframe | How much time each candle covers | Whether one candle is 5 minutes or 1 day |
| Candles | Price movement inside each period | Color, body size, and wick length |
| Volume | How much of the coin was traded? | Whether moves happen on strong or weak activity |
| Trend | The general direction of price | Whether highs and lows are rising, falling, or flat |
Make this a habit. The scan takes under a minute and prevents plenty of confusion.
How to Read a Crypto Candlestick
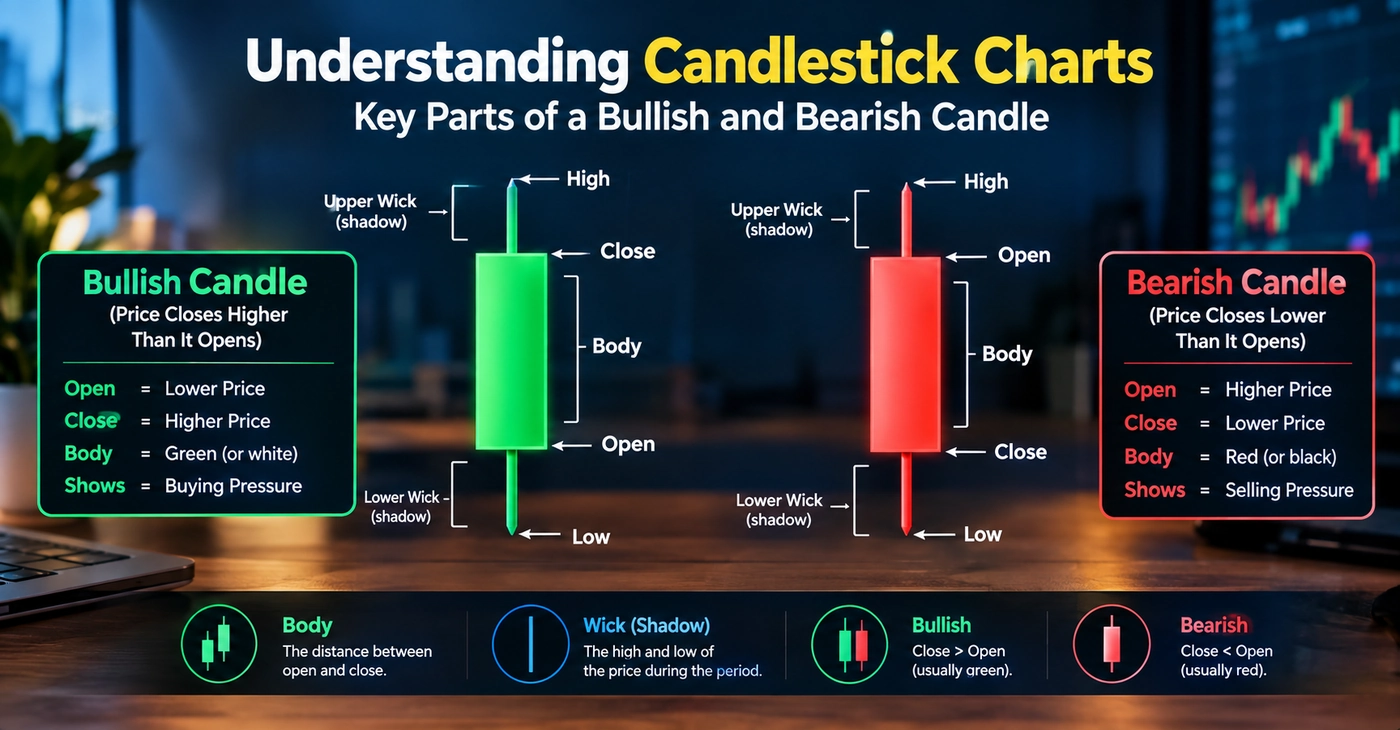
If you only master one skill, make it this one. Each candle summarizes one period of trading using four prices, known as OHLC: open, high, low, and close. You can find a solid background reference in Investopedia’s candlestick guide.
The Parts of a Candlestick
| Component | What It Means |
|---|---|
| Open | Price at the start of the period |
| High | Highest price reached in the period |
| Low | Lowest price reached in the period |
| Close | Price at the end of the period |
| Body | The thick part between open and close |
| Wick (shadow) | The thin lines above and below the body, marking the high and low |
New terms can pile up quickly, so keep our Crypto Glossary open in another tab.
Bullish Candle vs. Bearish Candle
A bullish candle, usually green, closes higher than it opened. The bottom of the body is open, and the top is closed. Buyers finished the period in control.
A bearish candle, usually red, closes lower than it opened. The top of the body is open, and the bottom is closed. Sellers had the upper hand.
Colors can differ between platforms, so check your settings.
What Body and Wick Size Suggest
- Long body: a strong, one-directional move.
- Small body: indecision, with no clear winner.
- Long upper wick: price rose, but sellers pushed it back down.
- Long lower wick: price fell, but buyers pushed it back up.
For a visual, step-by-step version, read our candlestick reading guide, How to Read Charts.
Crypto Chart Timeframes Explained
The timeframe sets how much time each candle represents. The same coin can look bullish on one timeframe and bearish on another, and both views can be correct.
| Timeframe | Typical Use |
|---|---|
| 1 minute | Very short-term scalping. Extremely noisy |
| 5 minutes | Short-term day trading |
| 15 minutes | Intraday trading with slightly less noise |
| 1 hour | Popular with day traders and swing traders |
| 4 hours | Swing trading. A good balance of detail and clarity |
| Daily | Position trading and longer-term trends |
| Weekly | Big-picture structure for long-term investors |
Traders choose different timeframes because their goals differ. A day trader may hold a position for minutes, so a 5-minute chart matters. Someone holding for months cares about daily and weekly candles.
Most beginners do well starting with the daily chart. It filters out short-term noise, and each candle shows a full day of activity. A good habit is to check the higher timeframe first for direction, then zoom in for detail.
How to Identify a Crypto Market Trend
A trend is the general direction of price. You can spot it by looking at the swings.
- Uptrend: higher highs and higher lows. Each peak and each dip sits above the previous one.
- Downtrend: lower highs and lower lows. Each bounce fails lower, and each drop goes deeper.
- Sideways market: price moves between a ceiling and a floor with no clear direction. Crypto spends a lot of time here, and beginners often see false signals in this phase.
You can also draw a trend line. In an uptrend, connect a series of higher lows. In a downtrend, connect lower highs. The more times the price reacts at the line, the more traders tend to respect it. Still, trends reverse, so treat them as a description of what has happened, not a promise of what comes next.
To connect chart moves with the wider story, follow the latest crypto market news. Market News For more beginner-friendly explanations of how markets and coins work, see Coinbase Learn.
Support and Resistance in Crypto
Support and resistance form the base of most chart analysis.
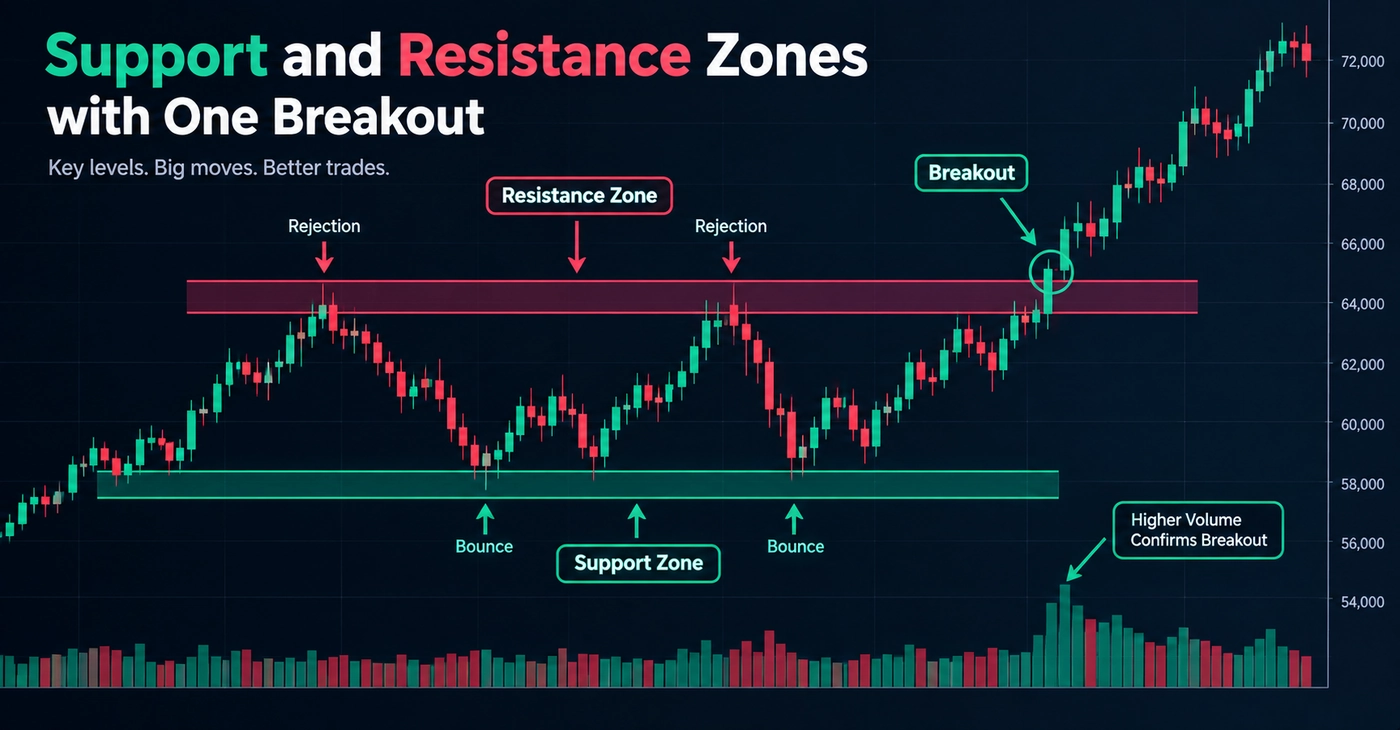
- Support is a price area where buying interest has previously slowed or stopped a decline.
- Resistance is a price area where selling pressure has previously stalled or reversed a rise.
Think of support as a floor and resistance as a ceiling. Treat them as zones, not exact lines. Price rarely turns at precisely $2.00, but it may react anywhere between $1.95 and $2.05.
Why These Levels Matter
Traders remember where the price turned before, and many place orders around those areas. That shared behavior is why support levels and resistance levels get tested again and again. A broken support often becomes resistance later, and the reverse can happen too.
Breakouts and False Breakouts
A breakout happens when price moves beyond a support or resistance zone. Breakouts get more attention when volume rises with them.
A false breakout is when price pokes through a level, then quickly slides back into the old range. These are common in crypto. That is why many beginners wait for a candle to close beyond the level instead of reacting to a quick spike.
Common Crypto Chart Patterns Beginners Should Know
Crypto chart patterns are recurring shapes that describe how price has behaved. They help you understand the market, but no pattern guarantees a future outcome. Treat them as possibilities, never certainties.
| Pattern | What It Looks Like | Common Interpretation |
|---|---|---|
| Triangle | Highs and lows squeeze toward a point. | Consolidation before a possible breakout either way |
| Double top | Two peaks at a similar level | Possible weakening of an uptrend |
| Double bottom | Two lows at a similar level | Possible weakening of a downtrend |
| Head and shoulders | Three peaks, the middle one highest | Possible reversal after an uptrend |
| Flag | A short, tilted pause after a sharp move | Possible continuation of the earlier trend |
| Wedge | Converging trend lines sloping up or down | Slowing momentum, with reversal or continuation both possible |
Two cautions apply to every pattern. First, patterns are easy to spot in hindsight and hard to confirm in real time. Second, they fail often. Practise on old charts before relying on them live, and browse our other chart guides Relevant Crypto Guid for more examples.
How Trading Volume Helps You Read Crypto Charts
Trading volume shows how much of a coin changed hands in a period. It usually appears as bars at the bottom of the chart. You can compare crypto volume across coins on CoinMarketCap, which also offers educational material.
Volume gives price moves context:
- Price up on rising volume: more participants are behind the move, which many traders see as stronger.
- Price up on falling volume: the move may lack conviction.
- Breakout on high volume: usually viewed as more meaningful than one on thin volume.
- Sharp drop on high volume: suggests heavy selling pressure.
One caveat: reported volume can be inflated on some smaller exchanges. Stick to reputable platforms, and if terms like “liquidity” are new, check what trading volume means in our Crypto Glossary. Volume is a supporting clue, not a verdict.
Technical Indicators for Crypto Charts
Technical indicators are calculations based on price and volume, drawn on or below your chart. They summarize what price has done. They do not predict the future. Binance Academy has detailed lessons if you want to study how each one is calculated.
Moving Average (MA)
A moving average smooths price by averaging it over a set number of periods, such as 50 or 200 days. It makes the trend easier to see. Price holding above a rising moving average generally reflects an uptrend.
Limitation: moving averages lag. They react after the price has already moved.
RSI (Relative Strength Index)
RSI measures the speed of recent price changes on a scale from 0 to 100. Readings above 70 are often called “overbought,” and readings below 30 “oversold.”
Limitation: in strong trends, RSI can stay in those zones for a long time. Overbought does not mean price must fall.
MACD
MACD (Moving Average Convergence Divergence) compares two moving averages to show momentum. It appears as two lines and a histogram. Crossovers are often watched as momentum shifts.
Limitation: it also lags, and it can produce many misleading crossovers in sideways markets.
A Simple Example: How to Analyze a Crypto Chart Step by Step
Let’s walk through how to analyze crypto charts using a completely hypothetical coin called ExampleCoin (XMPL). Every number here is invented for teaching.
- Trend. On the daily chart, XMPL has made higher highs and higher lows for six weeks. That suggests an uptrend.
- Timeframe. You start on the daily chart for direction, then check the 4-hour chart for detail.
- Candlesticks. The last three candles are green with medium bodies, but the latest has a long upper wick. Sellers pushed back near the top.
- Support. Price bounced twice near $2.00, so you mark $1.95 to $2.05 as a support zone.
- Resistance. Price stalled twice near $2.60, so you mark $2.55 to $2.65 as resistance.
- Volume. Earlier rallies came with rising volume, but the latest push toward $2.60 had lower volume. That is a mild caution flag.
- Indicators. The 50-day moving average slopes up and price sits above it. RSI is near 68, close to overbought. MACD is positive but flattening.
Your reading: the trend is up, but momentum may be slowing near resistance. Notice what you did not conclude: that price will definitely rise or fall. Good chart analysis helps you understand conditions and plan your risk, not forecast. Before acting on any idea, review our crypto safety tips Safety & Security.
Common Mistakes Beginners Make When Reading Crypto Charts
- Using only one indicator. No tool works well alone. Combine price action, volume, and one or two indicators.
- Ignoring timeframe. A “breakout” on a 5-minute chart may mean nothing on the daily.
- Assuming patterns guarantee outcomes. Patterns fail regularly. Plan for that.
- Ignoring volume. A move without volume support deserves extra doubt.
- Trading on emotion. Fear of missing out and panic selling are costly. Decide your plan before you act.
- Overcomplicating charts. Five indicators and ten trend lines create noise. Simple charts are easier to read.
A Beginner’s Crypto Chart-Reading Checklist
Save this and run through it every time you open a chart:
| Step | Question to Ask | Done? |
|---|---|---|
| 1 | Which coin and trading pair am I viewing? | ☐ |
| 2 | What timeframe am I on, and what does the higher one show? | ☐ |
| 3 | Is the trend up, down, or sideways? | ☐ |
| 4 | Where are the nearest support and resistance zones? | ☐ |
| 5 | What are the latest candles telling me? | ☐ |
| 6 | Is volume supporting the move? | ☐ |
| 7 | What do one or two indicators add? | ☐ |
| 8 | What would prove my read wrong, and how much can I risk? | ☐ |
FAQs
How do I start learning how to read crypto charts?
Begin with a daily candlestick chart. Learn what one candle shows, then add trend, support and resistance, and volume. Add indicators last.
How do I read candlesticks in crypto?
Each candle shows the open, high, low, and close for one period. A green (bullish) candle closed higher than it opened. A red (bearish) candle closed lower. The wicks show the highest and lowest prices reached.
What is the best timeframe for beginners?
The daily chart is a good start because it reduces short-term noise. Once comfortable, add the 4-hour chart for more detail.
What do support and resistance mean in crypto?
Support is a zone where falling prices have previously slowed because of buying interest. Resistance is a zone where rising prices have previously stalled because of selling pressure.
What does volume mean on a crypto chart?
Volume is the amount of a coin traded in a period. Higher volume during a price move generally means more participation behind it.
What does RSI mean?
RSI is a momentum indicator scaled from 0 to 100. Above 70 is commonly called overbought and below 30 oversold, but neither is an automatic buy or sell signal.
What does MACD mean?
MACD compares two moving averages to gauge momentum. Traders watch line crossovers and the histogram, but it lags price and can mislead in choppy markets.
How can beginners practise chart reading?
Use a free charting platform to study historical charts. Mark trends, support, and resistance, then check what happened next. You can also paper trade with virtual funds. It also helps to understand what you are buying and where it is stored, so read about wallets and storage
Conclusion
Knowing how to read crypto charts is really about building a routine: check the pair and timeframe, find the trend, mark support and resistance, read the candles, confirm with volume, and use indicators as backup. Each step is simple alone. Together they give you a clear way to understand price movements.
Remember that technical analysis describes probabilities, not certainties, and crypto markets are volatile. Start small, practise on historical charts, and keep learning with CryptoCoinXInfo. For your next step, continue with this related guide Crypto